
I work in a small lab. The number of bioinformaticians hovers around 1 to 1.5. We prioritize interaction with the data, so we do not spend the effort to implement things from scratch unless we absolutely need to. We start with what’s out there and adapt it as necessary. That means I have installed, used, adapted, or repurposed many shapes or sizes of bioinformatics tools. In terms of usefulness, they run the gamut from “I deeply regret installing this” to “Can I have your autograph?”. Some patterns emerge distinguishing those that are most pleasant to work with, and that’s the topic of today’s post.
Here’s what a great tool should do.
- Separate code from data.
- Proactively offer lots of QC reports. Lots more tips on this below.
- Don’t leave tons of big files lying around. Usually I would advise keeping a single BAM file of aligned, filtered reads as the biggest output.
- Offer a general-use tool or a single-use pipeline, or (preferably) both separately. Don’t expect users to tease out individual components from a pipeline.
- If you use Python, then offer a Conda environment or a virtual environment with the right package versions. Don’t expect users to install all the right stuff from scratch. My big brother wrote more about reproducible python package management here.
- If you offer a pipeline, don’t build everything from scratch. Use a modern pipelining tool. I explain more about this below, and for LSF users I have written configuration advice here.
About pipelining tools
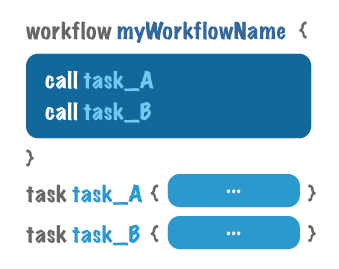
(This image is from the Broad WDL guide.)
There’s a class of tools for pipelining. Examples include Workflow Description Language, Snakemake, Martian, and BigDataScript. They don’t all have all the same features, but there’s a lot of overlap in the advantages they carry. From least to most important:
- If a run is interrupted, you can often pick up where you left off automatically.
- You can move your pipelines easily from one machine to another, even if one uses LSF and the other uses SGE or SLURM. Some of these tools even let you send jobs to an AWS account.
- Since the interface with the job scheduler is already built, you can often parallelize things trivially.
- The core syntax of your pipeline is clean and easy to read, even as you’re enjoying all the benefits mentioned above.
I am not an expert on this topic, but my top recommendation is WDL, because it prioritizes readability. Learn more about it here.
About QC and metadata
For every new NGS-based method we implement in the lab, we end up asking the same question: where are the inefficiencies? A pipeline will often trim adaptors, align reads, remove PCR duplicates, detect signals (e.g. peaks in ATAC-seq; cells in single-cell RNA-seq) and produce counts (e.g. reads in peaks in ATAC-seq or transcript counts in RNA-seq). If you end up getting back less information than expected, it’s natural to ask where the loss is happening: too many PCR duplicates? Low alignment rates? Lots of reads outside your ATAC peaks? Barcode problems? You will usually benefit from logging the following basic items.
- the total number of raw reads
- the number of useful reads after all filtering
- the rate of unique alignment and multiple alignment
- the PCR duplication rate
- the fraction of reads in peaks versus outside them (for ChIP/ATAC)
- the fraction of intronic / exonic / intergenic reads (for RNA-seq)
- the fraction in cells versus empty droplets (for single-cell assays)
- the fraction with valid barcodes, wherever barcodes are used
- the signal track as a bam, bedgraph, or bigwig, so you can look up specific features in IGV.
- the rates of paired-end alignment: how often do zero, one, or both reads align? How far from each other do they align?
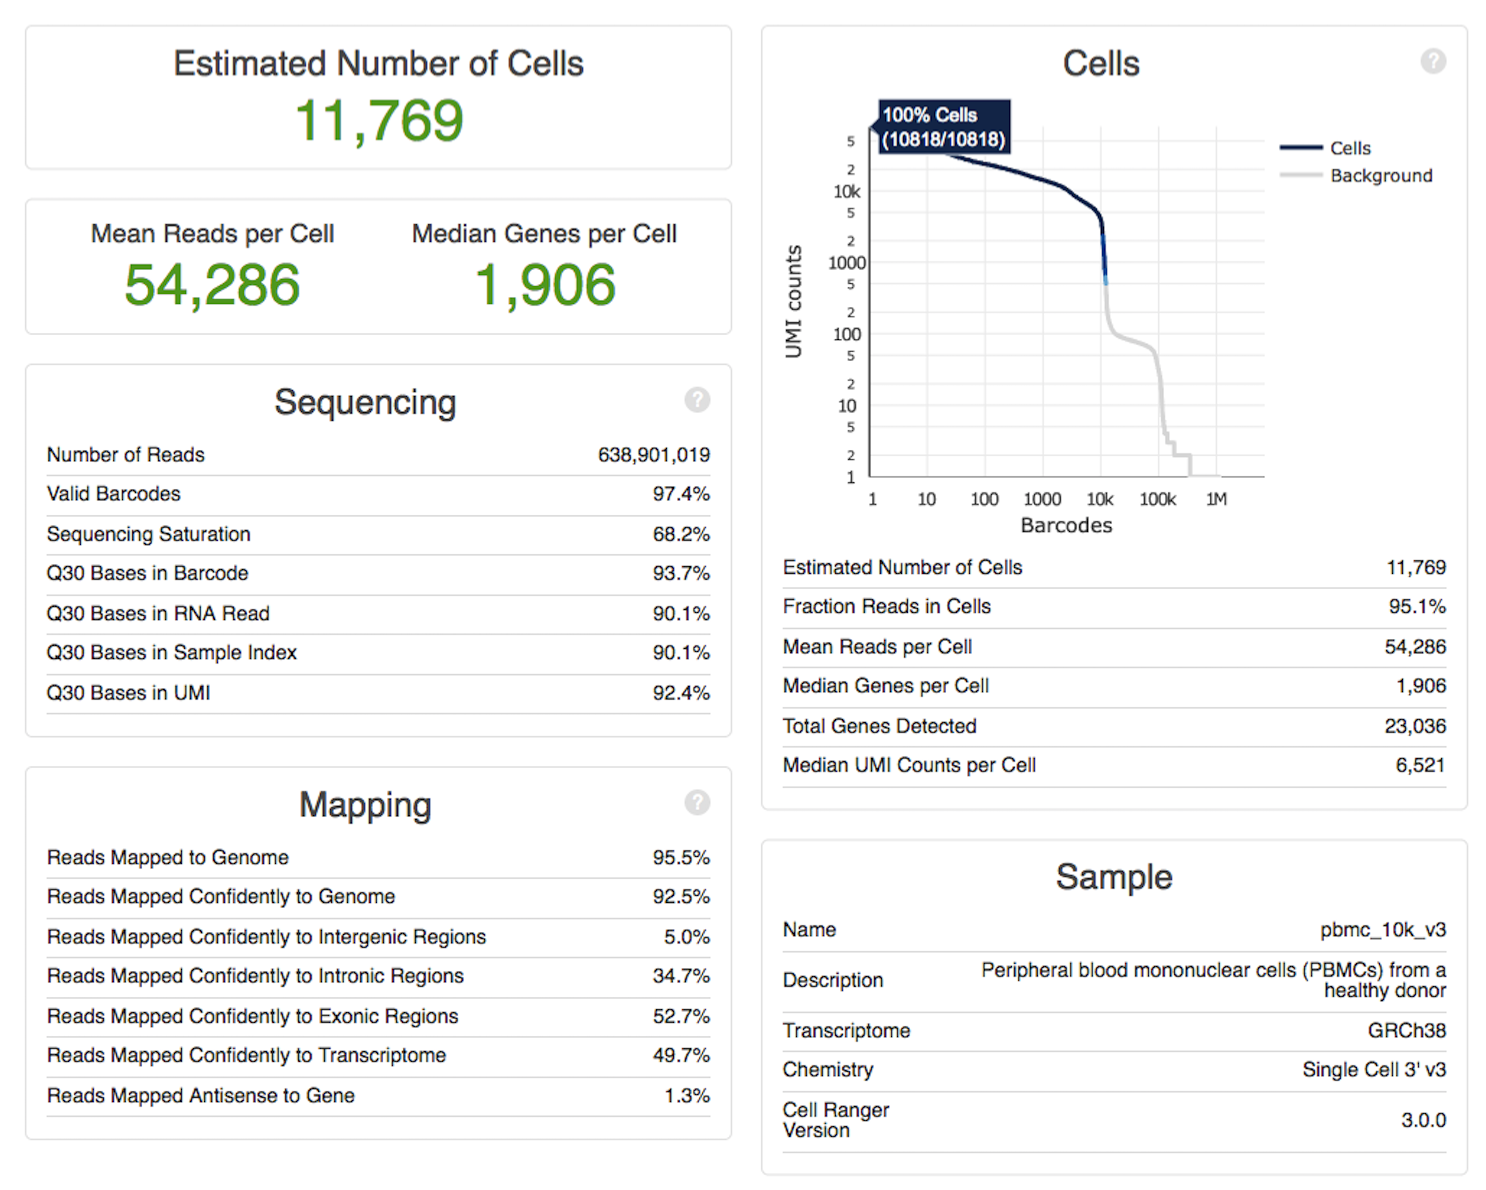
(Image is a screenshot of Cellranger’s QC summary for single cell RNA-seq, which shows cellcount, per-cell depth metrics, reads in cells, alignment and PCR duplication rates, and barcoding/Q30 metrics.)
There are certain items that are more important for particular assays. For single cell assays, it’s useful to have various measurements per cell in addition to having totals. For well-based assays, you should work out a way to display the pattern of low-quality wells as they appear physically on the plate. Sometimes there’s a barcoding mistake, and it will show up as a near-empty row or column. For ATAC-seq, you should plot the insert size distribution – sometimes you’ll see size selection batch effects.
This year, we’ve explained or fixed a lot of technical questions by keeping a close eye on this type of quality control. Most of these were either wet-lab errors or weaknesses of the protocol that were not explicitly named in the publication. Sometimes, though, we might uncover a problem with the exon annotations, or the alignment rates might reveal that I aligned a human sample to the mouse genome :/. It feels good to get to the bottom of these things.
QC Footnote
We ran into a particularly sneaky issue this summer working with 10X single-cell RNA data. If we download the reads from illumina, rather than downloading the images and calling reads using cellranger mkfastq, we lose about 30% of the reads! It’s important to keep an eye on this type of thing. We’ve also had other issues appearing in the very earliest steps of the pipeline: grumpy old sequencing machines or bad kits where the read quality suffered.