
Bubble plots resolve overplotting
[software single_cell maehrlab 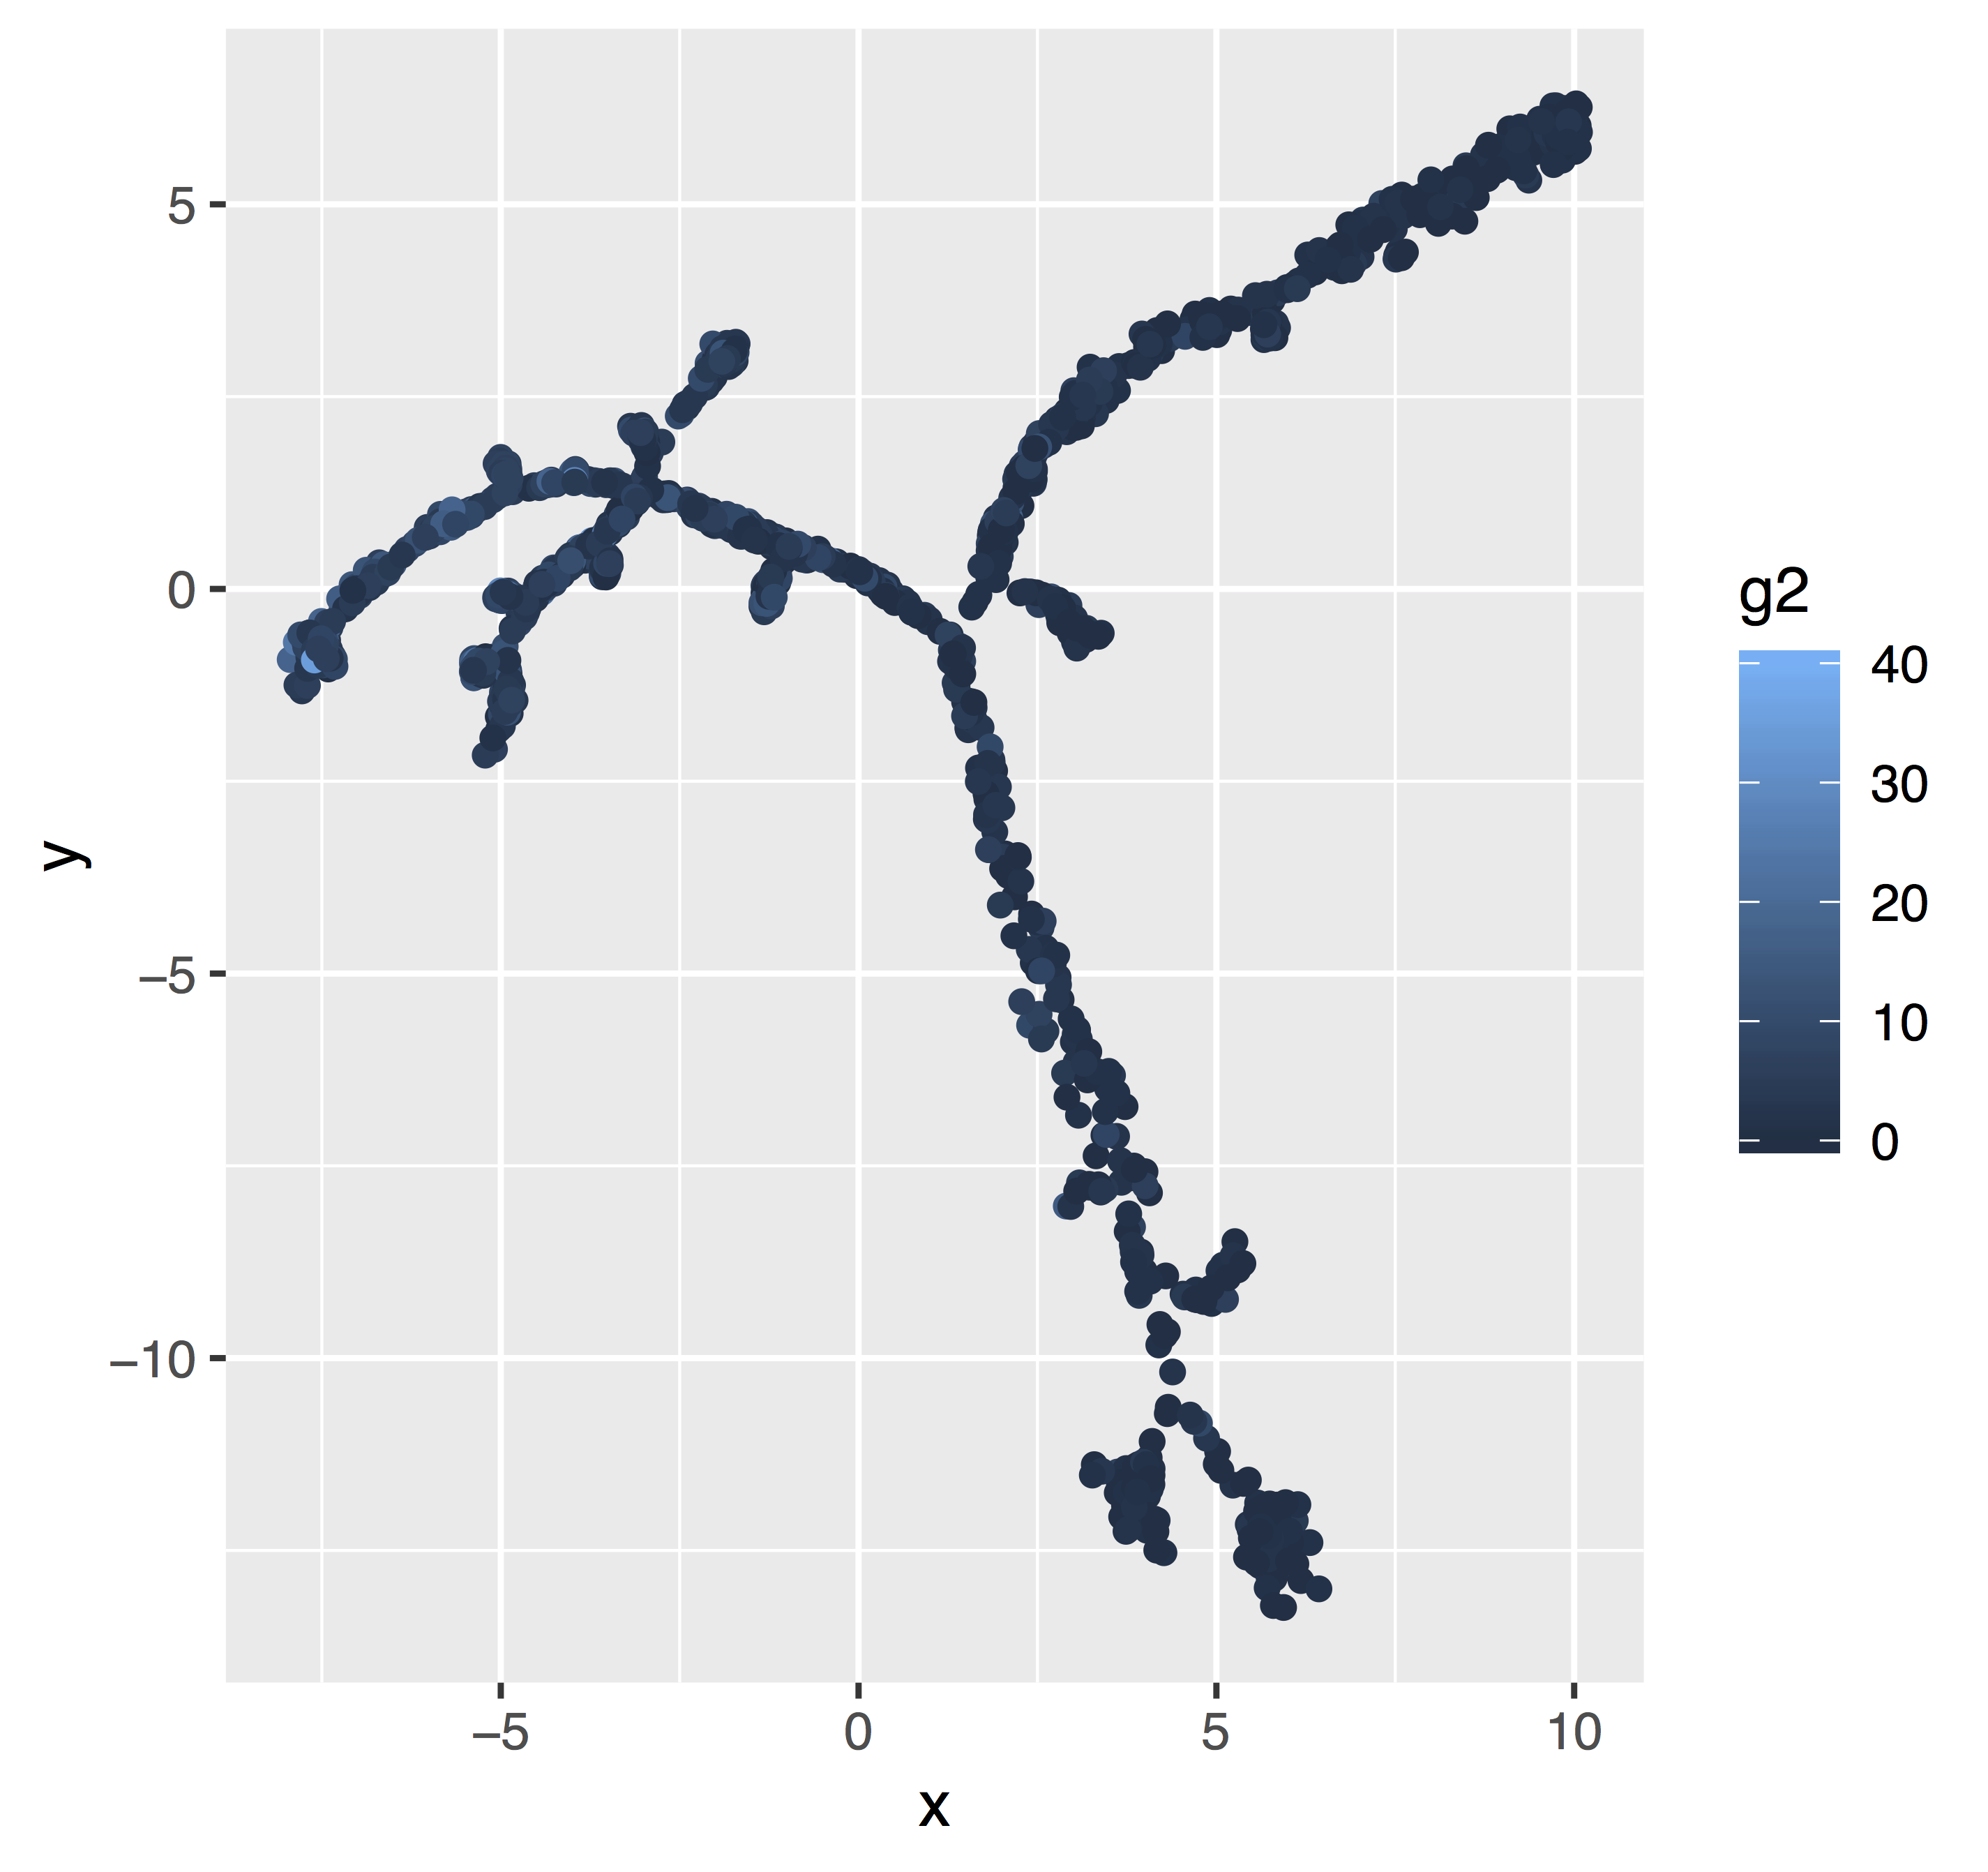
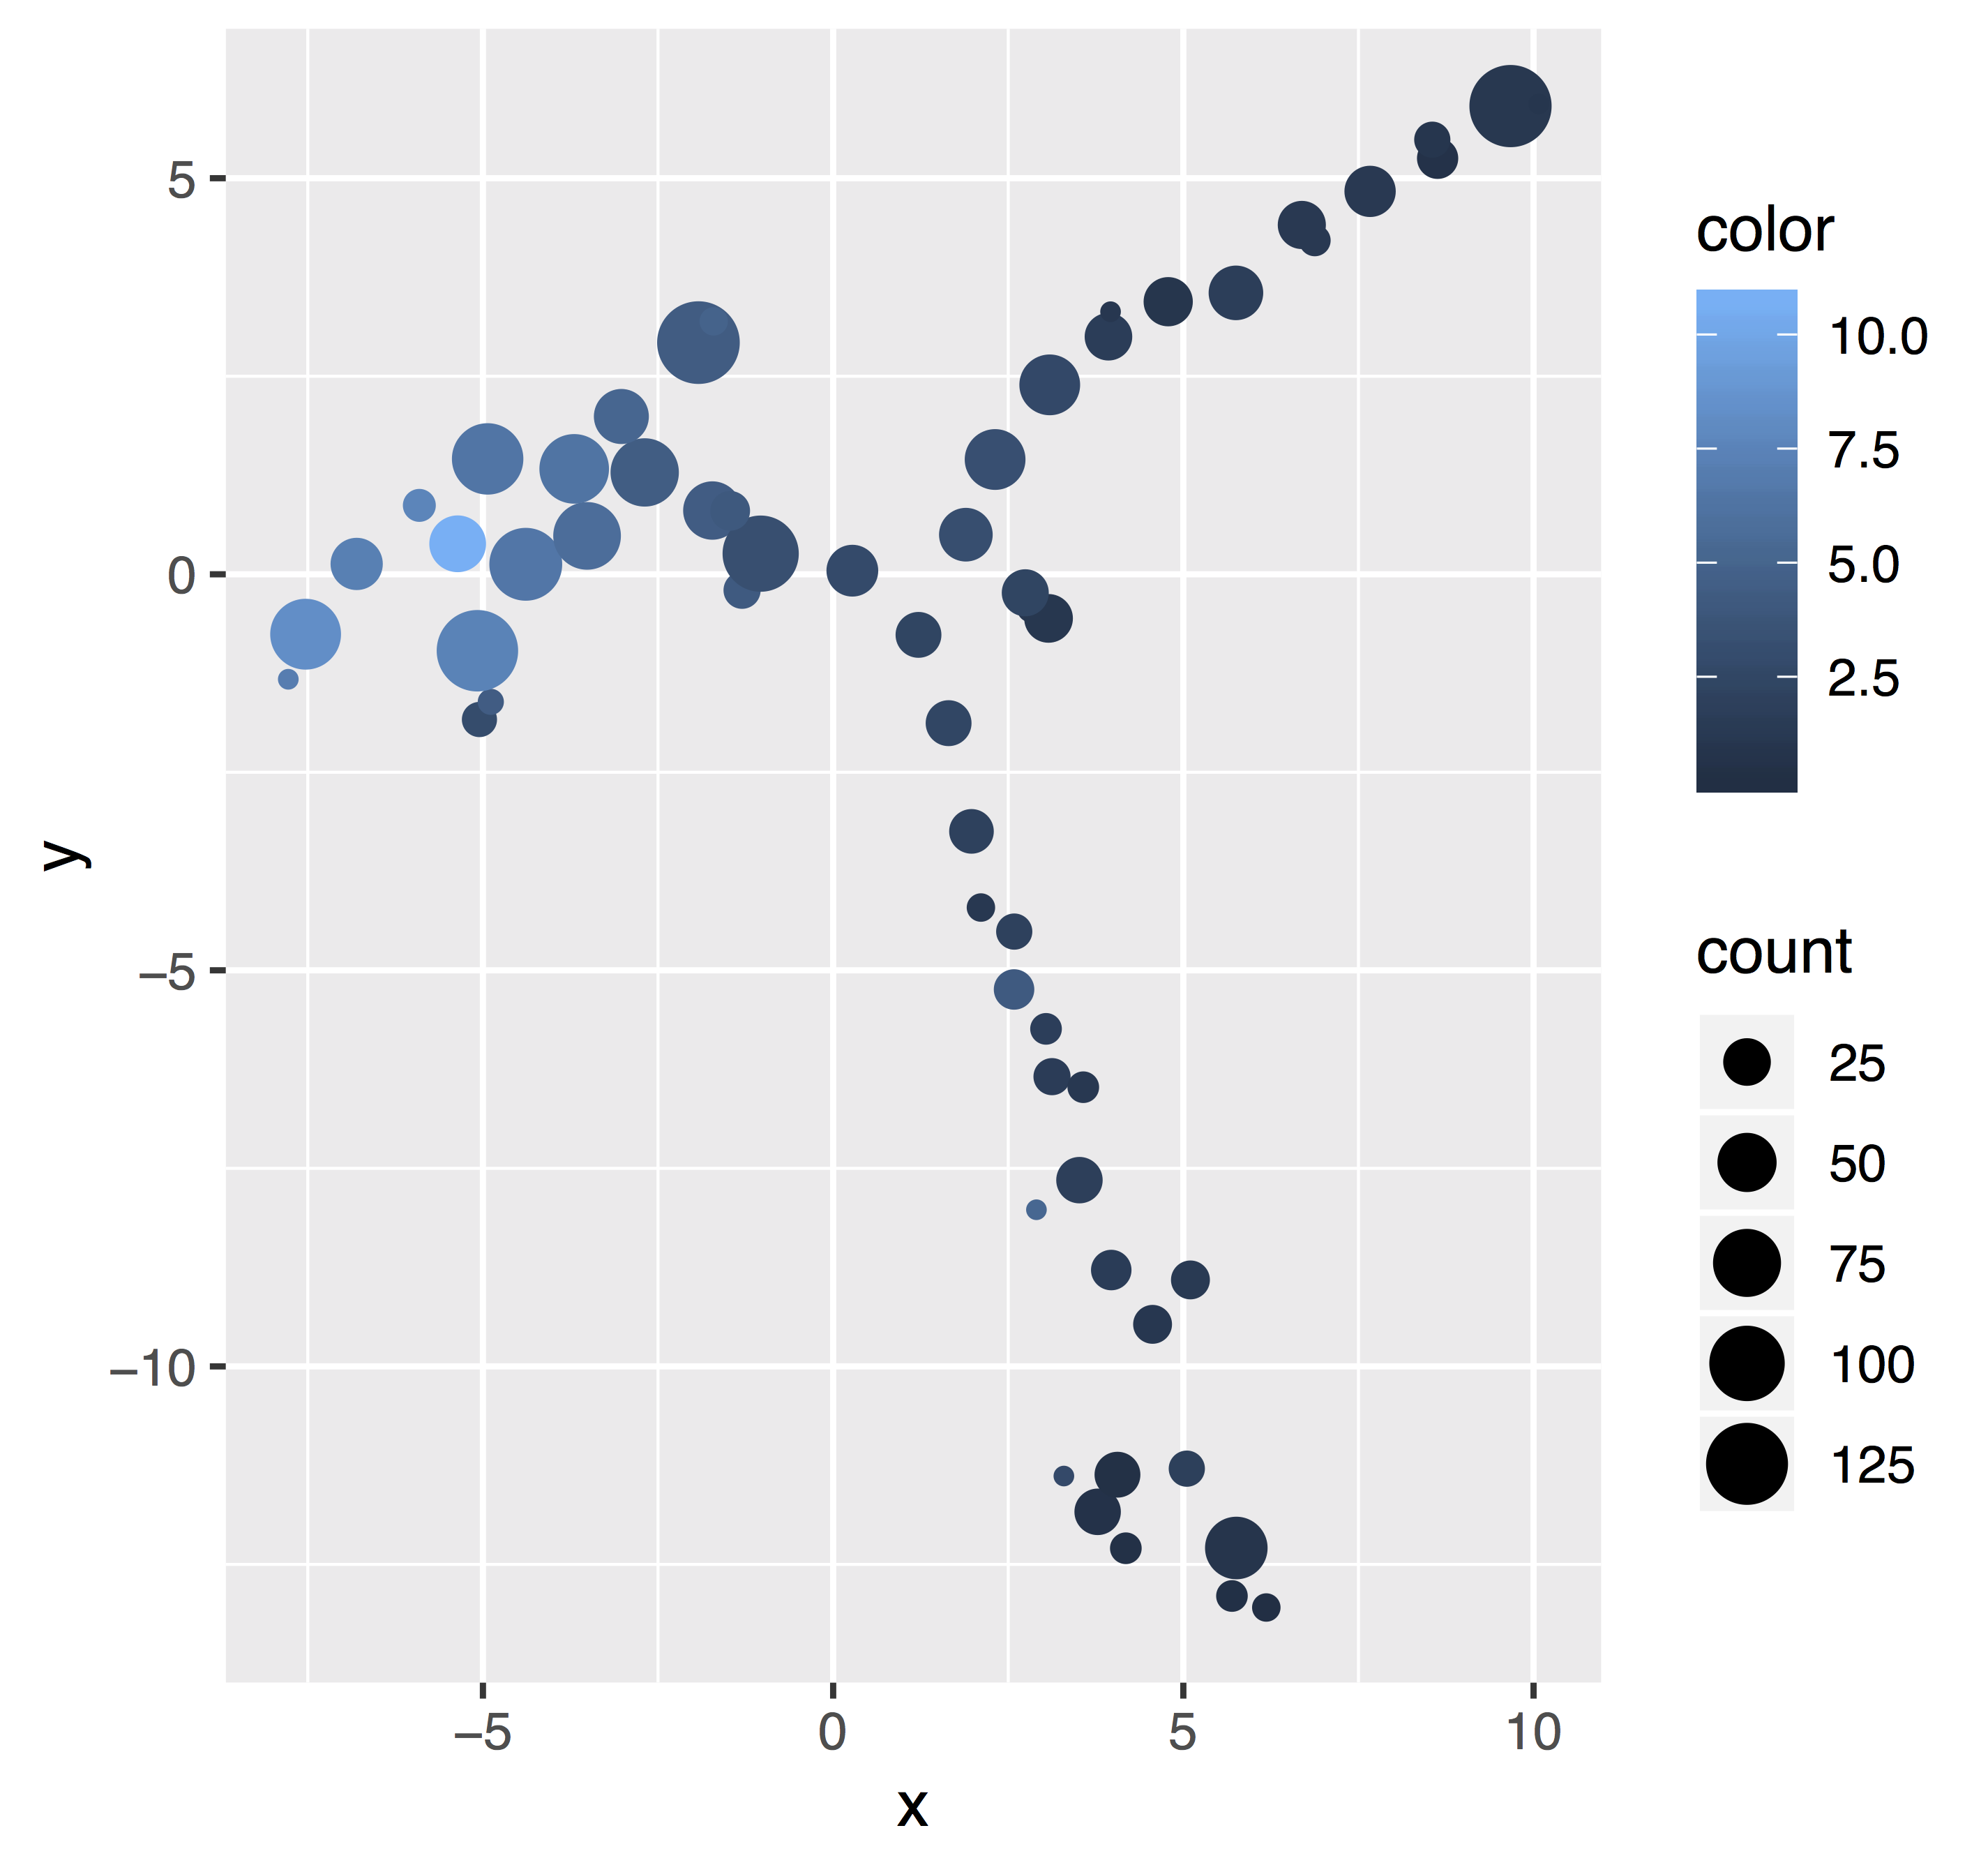
bubblegrid helps you see your data when a plain scatterplot would be overplotted. It aggregates points within a hexagonal grid. In each grid cell, the point count is shown as the bubble size. For quantitative variables shown by color, values are averaged. See https://github.com/maehrlab/bubblegrid for more information.
Written on November 28, 2020