
This is a short version of the full post about TracerSeq.
I recently hosted a discussion in the lab on two Science papers that had sequenced the whole zebrafish embryo at multiple timepoints. Between those two papers, the zebrafish lineage tree is reconstructed using three different datasets and at least four algorithms. The results disagree with each other and with conventional knowledge in fundamental ways. I’m talking about formation of some of the earliest specialized tissues in the embryo – something I assumed was settled long ago. Is the spinal cord seriously part of its own new germ layer, separate from the rest of the nervous system? What’s going on here?
It turns out that there’s actually a fundamental misunderstanding. The technologies used do not all reconstruct the same conceptual “lineage tree”. There are two different kinds of trees. They are related but distinct, and they deserve different names and careful definitions. In this post, I want to fill in the missing theory, which the paper sadly did not allocate enough space for.
Background
Lots of people have started to run single-cell sequencing to run experiments on developing tissues (from stem cell protocols or embryos). Each cell analyzed can be represented as a point in “transcriptome space”: a list of counts for each of 20-30k different transcripts. Once the count data have been acquired, one common analysis technique is pseudo-time analysis: follow the path the cells took through transcriptome space. Sometimes the path is a simple trajectory, but often it is assumed to have a branching structure – for example, intestinal stem cells might give rise to either barrier cells or goblet cells, and this would create a branching-off point. This conceptual model is often called a lineage tree.
This blog post digs into a parallel technology called TracerSeq. On the surface, it seems like another independent method for inference of lineage trees. It’s not. For the rest of this post, I’ll avoid the term “lineage tree”, because there are actually two different conceptual models here, which govern different biological processes and deserve different names. Details follow.
What is TracerSeq?
TracerSeq is a clonal tracing method: it helps you figure out which cells came from which in the developing embryo. Here’s the paper.
Wagner, D. E., Weinreb, C., Collins, Z. M., Briggs, J. A., Megason, S. G., & Klein, A. M. (2018). Single-cell mapping of gene expression landscapes and lineage in the zebrafish embryo. Science, 360(6392), 981-987.
Links: Wagner et al
It’s based on a system of random barcoding. The model system of choice in the paper is a zebrafish embryo. When the embryo is still a single cell, Wagner et al. inject a boatload of random barcodes. Free-floating barcodes get divvied up by cell division: every time the cell splits, the daughter cells contain a different mix of barcodes. The barcodes also gradually get patched into the genome due to the details of the system they used. Once a given barcode molecule integrates into the genome, the barcode is copied at every cell division, so all the daughter cells share that barcode. You can use shared barcodes to infer shared ancestry between cells.
What do the results look like?
Wagner et al. look at zebrafish embryos from various stages of development leading up to 24 hours. (On a human scale, that’s sort of like 4 weeks. For developmental biologists, it’s at ~30 somites.) The zebrafish has a wide variety of specialized tissues – brain, spinal cord, gut tube, tail bud, epidermis – and the little fishy heart is just starting to beat.
In the first part of their paper, Wagner et al. reconstruct a tree using plain scRNA-seq (no TracerSeq) from various time points. At the final 24-hour time-point, Wagner et al. also sequenced TracerSeq embryos. So, does TracerSeq tell us the same story about how the tissues arise?
No. TracerSeq results actually have little to do with tissue type as determined by single-cell RNA-seq. From the paper:
“Tracer-seq lineage groups tend to be organized by position (e.g., along the [anterior-posterior] axis) rather than strictly by germ layer/tissue origin (e.g., neural, epidermal, mesodermal).”
This was a big surprise to me. I’ve never taken a dev bio class, but since joining the Maehr lab, I have absorbed some of the field’s orthodoxy. I thought that the first major split in the lineage tree of any vertebrate would be between the three germ layers: ectoderm gives rise to skin and nerves; mesoderm gives rise to bones, muscles, and the heart; and endoderm gives rise to internal organs such as the stomach, liver, pancreas, and thymus. The TracerSeq results do not follow ectoderm versus mesoderm versus endoderm. They produce a completely different partitioning of the organism!
Why?
There are different ideas of the concept of a lineage tree.
-
Tracer-seq infers clonal trees. In a clonal tree, the nodes are actual cells. Connections are literal mother-daughter relationships: if cell A divides into cells B and C, it forms a little “triad” in the graph.
-
Single-cell RNA-seq measures state-space trees. Nodes are regions within transcriptome space, not individual cells. Edges are pairs of abutting regions. An example “triad” in this graph might consist of molecular states for endoderm (embryonic gut tube), mesoderm (embryonic connective tissue) and mesendoderm (a multipotent state that gives rise to both endoderm and mesoderm). For historical reasons, I might also call these Waddington trees.
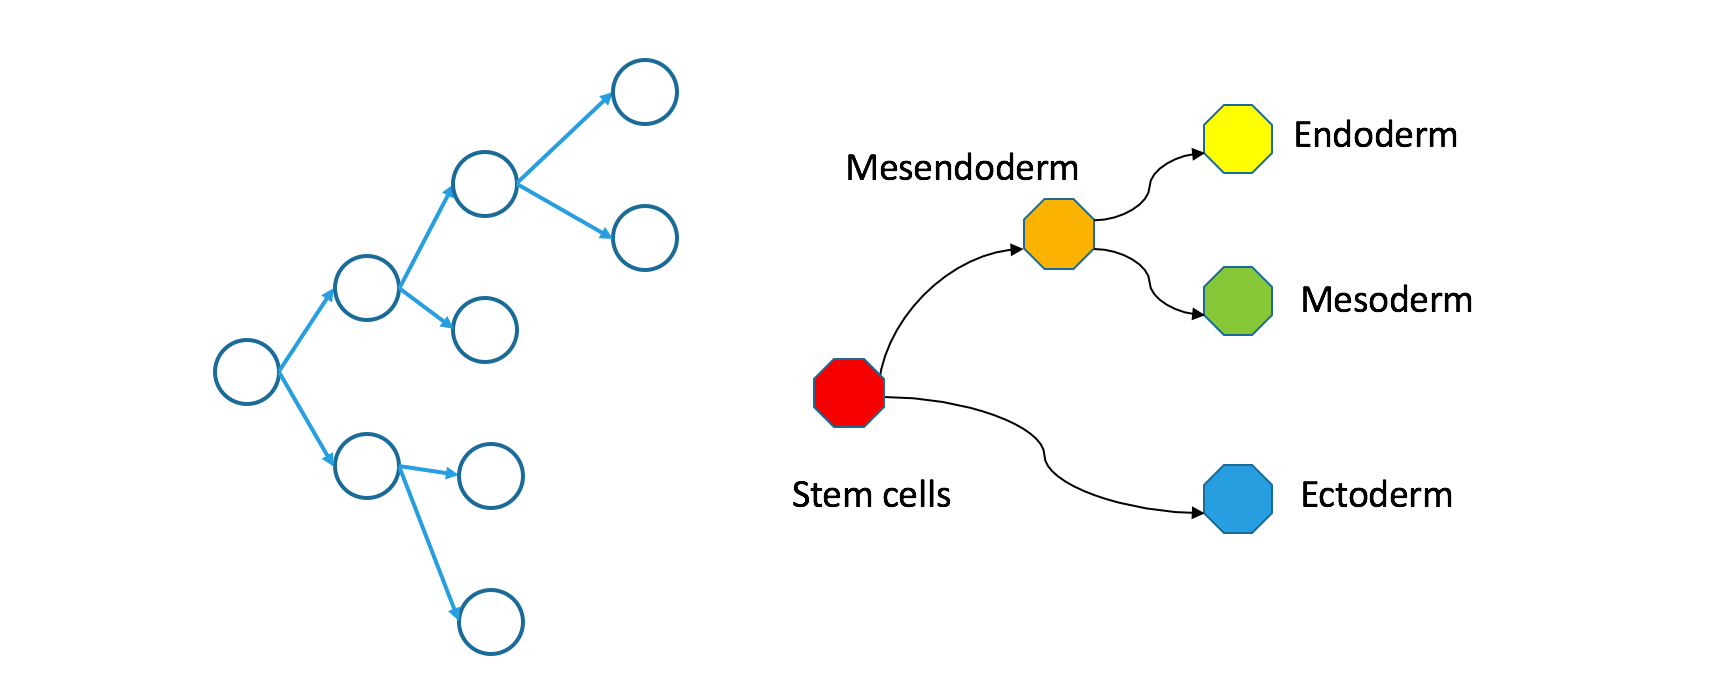
How do clonal and Waddington trees relate?
If you trace a descending path through a clonal tree, it will form a continuous path through the corresponding Waddington tree. That’s true because the Waddington tree includes any state occupied during natural development, and because natural development is effectively continuous.
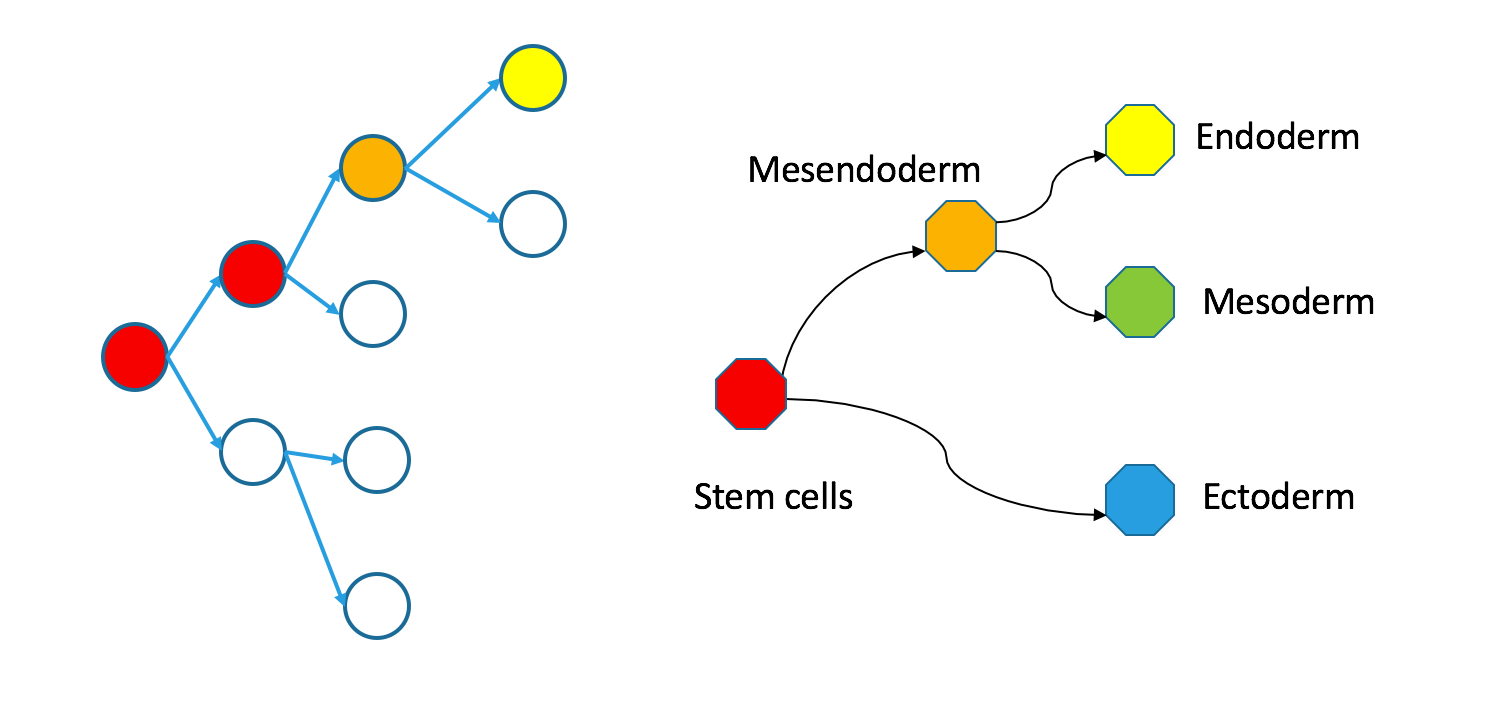
Even though individual cells follow contiguous paths through each tree, the two types of trees are not necessarily superimposable. Take a look at my counterexample.
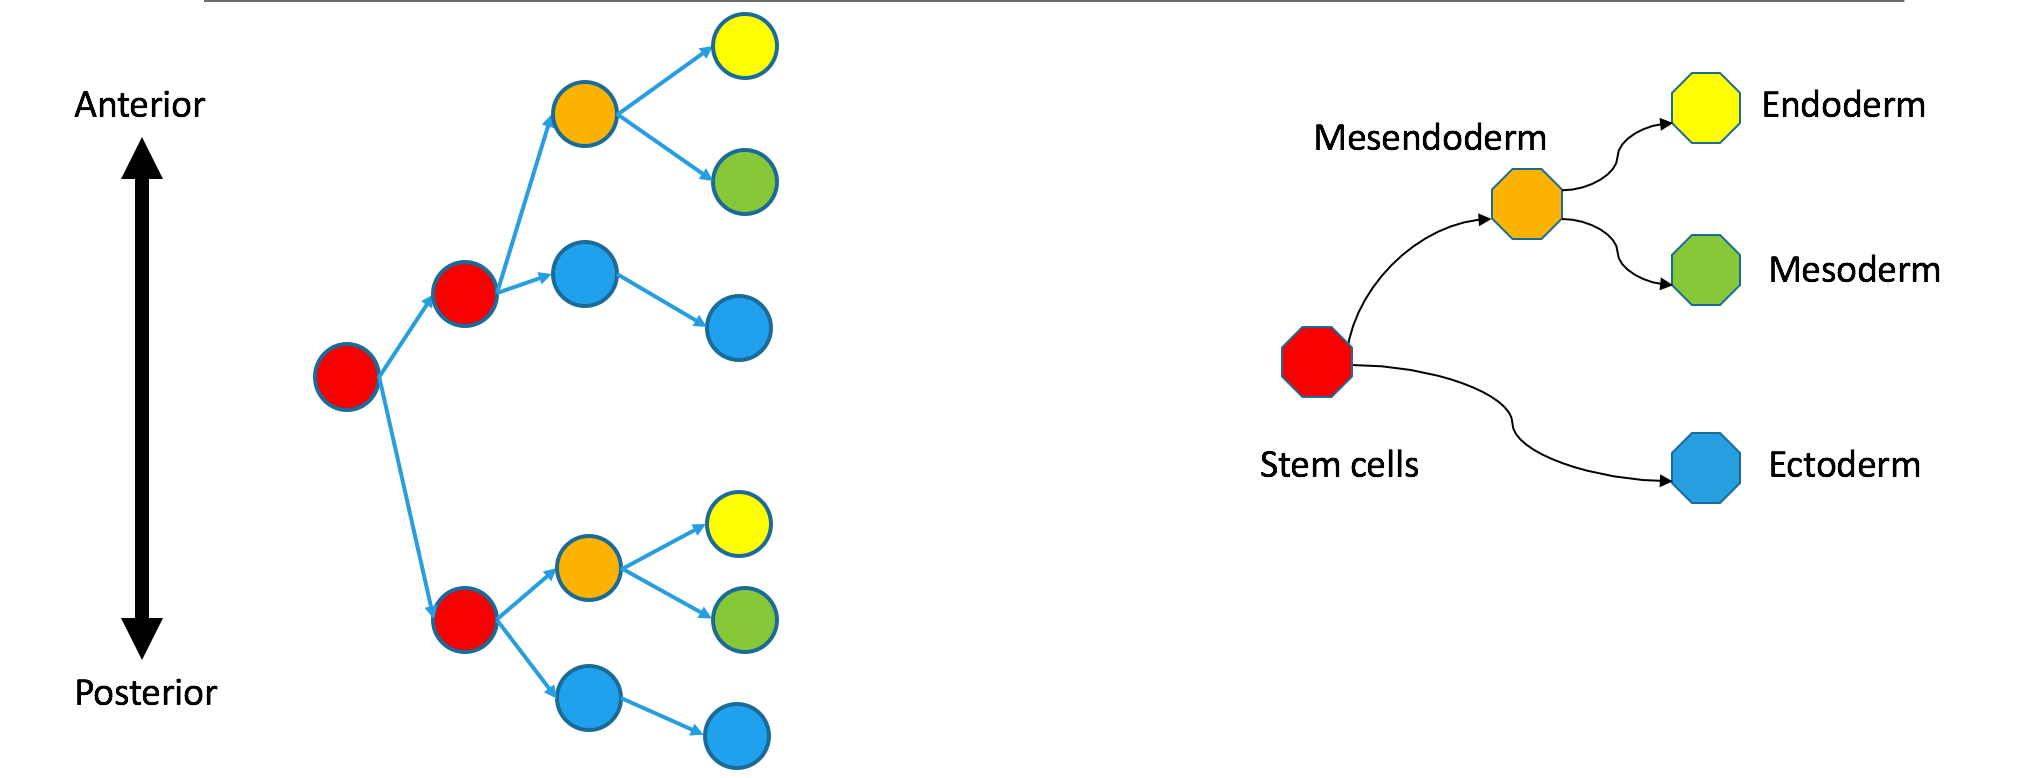
Correspondence between nodes is given by color, with blue mapping to blue, et cetera. The “ectoderm” subtree of the Waddington tree is the blue node on the bottom right (ectoderm gives rise to skin and neurons). It does not have a single origin in the clonal graph: it contains two separate subtrees of the clonal tree.
I want to emphasize that these trees are still biologically compatible. Cells may vary independently in terms of both transcriptional identity and clonal origin. This could happen if the ectoderm and mesendoderm separated independently in the anterior and posterior parts of the embryo. An extreme example of this would be to take the two subtrees in the diagram to be identical twins that came from the same zygote. Their shared clonal tree will have two subtrees that are heterogeneous, each eventually containing all the specialized tissues that make up an organism.
Observations of of a clonal tree should not be taken as evidence against biological models based on state trees, which say that differentiation begins with the separation of ectoderm and mesendoderm. They just mean that some clonal separation happens before germ-layer separation.
Bonus material
TracerSeq also tends to amplify the differences between the two types of trees. In the counterexample, recall that the difference arose when cells diverged clonally first, and then diverged in state space. Tracer-Seq tends to emphasize these early clonal divisions that happen prior to divergence along the Waddington/state tree. In the authors’ words,
“… [T]he current timing of TracerSeq integrations encompasses the transition from unrestricted pluripotency to the first fate restriction events appearing in the zebrafish embryo.”
I discuss this more thoroughly in the full post.