
Five flavors of stratified LD score regression (Part 5, Melon)
[stat_ml - Motivation
- Key formulas
- Empirical results
- More quantitative detail: assumptions, derivations, and simulations
- Coda
Stratified linkage disequilibrium score regression (S-LDSC) is a workhorse technique at the intersection of human genetics and functional genomics, but its exposition is heavily genetics-coded. In cell biology and functional genomics, it is less well-known and well-understood than would be optimal. This post is part of a series introducing many flavors of S-LDSC for the newcomer.
- Vanilla (original LDSC)
- Strawberry (stratified LDSC)
- Cranberry (cross-trait LDSC)
- Lime (signed LDSC)
this post -->Melon (mediated expression score regression)
Motivation
Most genetic information about polygenic human traits is carried not in coding regions, but outside them. A major agenda of quantitative genetics in the 2010’s and 2020’s has been to explain how non-coding genetic variants can so heavily alter disease risk in aggregate. A major pillar of that agenda is the use of gene expression as a potential intermediate: variants affect gene expression and gene expression affects disease risk. This assumed chain of events is hard to test directly: even when fine-mapping shows that one variant affects both gene expression and disease risk, multiple causal structures are compatible with that.
- variant –> expression –> disease
- variant –> disease –> expression
- variant –> disease and variant –> expression, but not expression –> disease or disease –> expression
Furthermore, fine-mapping is hard, and in most cases, we cannot rule out that there are two separate SNPs in LD, with one affecting expression and the other affecting disease risk.
By now you know the drill: let’s come up with a flavor of LD score regression that aggregates information across the whole genome to distinguish two similar-seeming drivers of genetic association, while natively accounting for LD. Enter our last flavor, melon (mediated expression score regression=MESC, Yao et al.).
Key formulas
The assumed model for the phenotype is
\[y = X\gamma + XB\alpha + \epsilon\]where $X$ contains genotypes, $B$ contains effects of genotypes on gene expression, $\alpha$ contains effects of expression on the phenotype, and $\gamma$ contains genetic effects on the phenotype that are not mediated by gene expression. The $\gamma$ and $\alpha$ terms are assumed to be independent and Gaussian, with variance $\sum_C \tau_C$ or $\sum_D \pi_D$ being a sum of contributions from membership in different sets of variants or genes. These variance contributions $\tau_C$ and $\pi_D$ will be the targets of inference.
As usual, the method itself does not require direct observation of genotypes and phenotypes; it uses summary statistics and LD to infer regression slopes that describe how much heritability is mediated by certain mechanisms or classes of variants. The formula actually used for model-fitting is this.
\[E \left[\chi_{k}^{2}\right] = N \sum_c \tau_{C} \ell_{k ; C} + N \sum_D \pi_D \mathcal{L}_{k ; D} + 1\]A quick breakdown:
- We are back to modeling the squared association statistic for SNP $k$.
- The first term matches strawberry (stratified) LDSC. $C$ and $\tau_C$ are a set of SNPs and its per-SNP heritability contribution. $\ell_{k ; C}=\sum_{j\in C} r_{kj}^2$ is the stratified LD score, summing LD over variants in $C$. The difference between strawberry and melon is that here, $\tau_C$ measures effects that are not mediated by gene expression.
- For the second term, effects mediated by gene expression, the formula is in the same general shape. The set of SNPs $C$ is replaced by a set of genes $D$, and there is a separate learned weight $\pi_D$. But the LD score $\ell_{k,C}$ is replaced by a more complex “expression score”. The expression score sums up all possible two-stage effects where SNP $k$ is in LD with SNP $j$ and SNP $j$ affects expression of gene i: \(\mathcal{L}_{k ; d} = \sum_{i \in D} \sum_{j\in SNPs} r_{j k}^{2} \beta_{i j}^{2}\). As you compare this with the model for the phenotype, note that an uppercase $\beta$ is a $B$.
There are major complications here.
- Effects on gene expression and other phenotypes could be correlated for other reasons aside from the mediation MESC tries to capture. For instance, the expression could be downstream from the phenotype.
- Gene expression differs across cell types, and sometimes we measure it in the wrong cell type.
I will dig further into the reasoning and quantitative interpretation at the end of the post.
Empirical results
Sobering, that’s the results. Out of 42 complex traits, an average of 11% of heritability was expression-mediated. Only ten traits had expression-mediated heritability that was significantly above zero (Bonferroni correction, so, FWER<0.05). Genes with weaker eQTL effects tended to have stronger effects on phenotypes, perhaps due to selection.
Gene-set and tissue enrichment
Because they can slap in whatever gene sets they want, they slap in the Gene Ontology and run some enrichment analyses. I downloaded table S8 and sorted by effect size. The biggest hits were for the trait cholesterol, with gene sets functionally annotated by Gene Ontology for vesicle coatings, endocytosis, lipid localization, steroid metabolism, and alcohol metabolism. All this sounds very cholesterolish to me: cholesterol is a lipid, transported in coated vesicles, which get endocytosed. Steroids and cholesterol are chemically similar and have hydroxyl groups like alcohol. Also highly ranked were:
- bone density (trait) with gene-sets for Wnt signaling and organ morphogenesis, which sounds like a nod to the BMP family
- ENT diseases (trait) and eczema (trait) with gene-sets for cell adhesion (important to immune infiltration of diseased tissues?)
- Years of education (trait) with GO_REGULATION_OF_SYNAPSE_STRUCTURE_OR_ACTIVITY
- Hypothyroidism with some really generic-sounding GO terms (???)
There are maybe 200 or so enrichments at FDR<0.05, with a lot of biologically sensible findings.
They also ran the procedure with expression effects from multiple cell types and found some sensible results: for years of education and schizophrenia, brain expression mediates more heritability than expression in other tissues.
More quantitative detail: assumptions, derivations, and simulations
Derivations
The main derivation is in supplement 1.1.2. The phenotype is assumed to result from genetic effects mediated by gene expression and direct genetic effects.
\[y = X\gamma + XB\alpha + \epsilon\]Parameters are assumed to be independent within and across the different vectors. Violation of these assumptions are tested via simulation; recap below. The assumptions make it pretty easy to do the usual LDSC derivation: multiply an $X_k^T/N$ through both sides; square both sides; wrap both sides in an $E[\cdot]$; and zero out a gajillion cross-terms. They do not show all this, but a cross-terms vanishes if it has:
- an $\alpha$ and a $\gamma$
- an $\alpha_j\alpha_k$ for $j\neq k$
- a $\beta_{ij}\beta_{\ell k}$ for $i\neq \ell$ OR $j\neq k$.
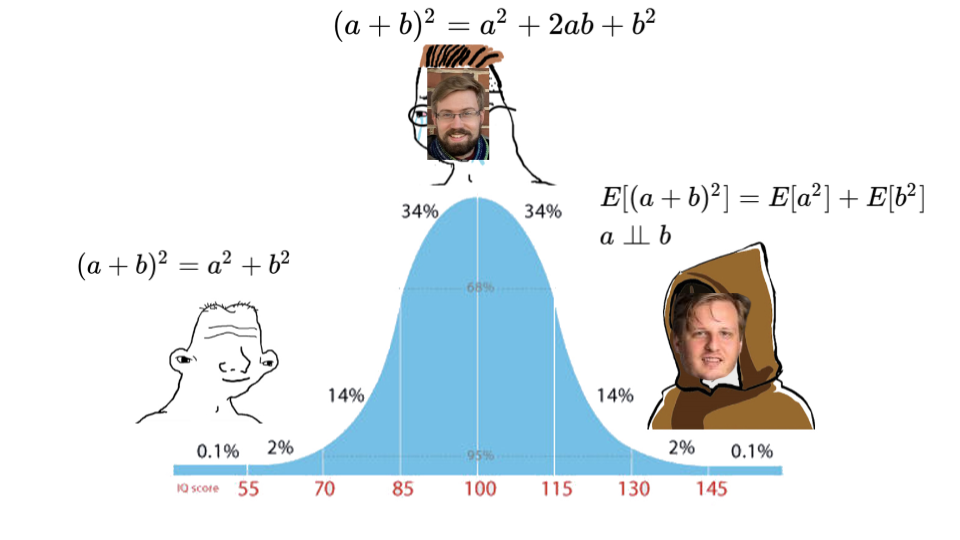
The independence assumptions allow them to engage in a habitual hobby of human heritability hobnobbers and pretend $(a+b)^2 = a^2 + b^2$. Beginner algebra students across the globe weep with envy.
There is another key derivation explaining what happens when gene expression effects are measured in the wrong cell type. Hopefully, expression is correlated between the cell type measured and the ideal cell type. Actually, all we need is for genetic effects on expression to be correlated, a.k.a. a genetic correlation. If the average (across genes) of the genetic correlation between expression in the measured and ideal cell types is $\rho$, then the MESC estimates for $\pi$ are off by a factor of $\rho^2$. This is given in full generality in supplement 1.1.3, and one of the hardest lines in the whole piece is supplement 1.1.3 section line 3, in which a bunch of LD terms $r^2_j$ and transcript effects $\alpha_i$ slide right through a covariance operator as if they were scalars. I suspect this could be formally verified with the Law of Total Covariance.
Simulations
They find all the expected results when the data are simulated according to their assumed model. They also simulated data violating key independence assumptions between SNP effects on expression and either gene effects on phenotypes or non-expression-mediated SNP effects. There is bias if the assumption violations are completely not handled. But, to handle them, simple adjustments can be made, such as splitting the genes up into groups with similar eQTL effect sizes or splitting the SNPs into groups with similar annotations.
Coda
That’s it for now. I hope you enjoyed this delicious buffet of LD score regression techniques. Maybe they can be of use as you bring together two domains with growing power and complementary value: functional genomics and human genetics.